Affordability Snapshot Tool
Mar 2026 - Mar 2026
Category: MVP
Used in 7 projects
Used in 22 projects
Used in 3 projects
Used in 2 projects
Used in 16 projects
Used in 10 projects
Used in 8 projects
Description
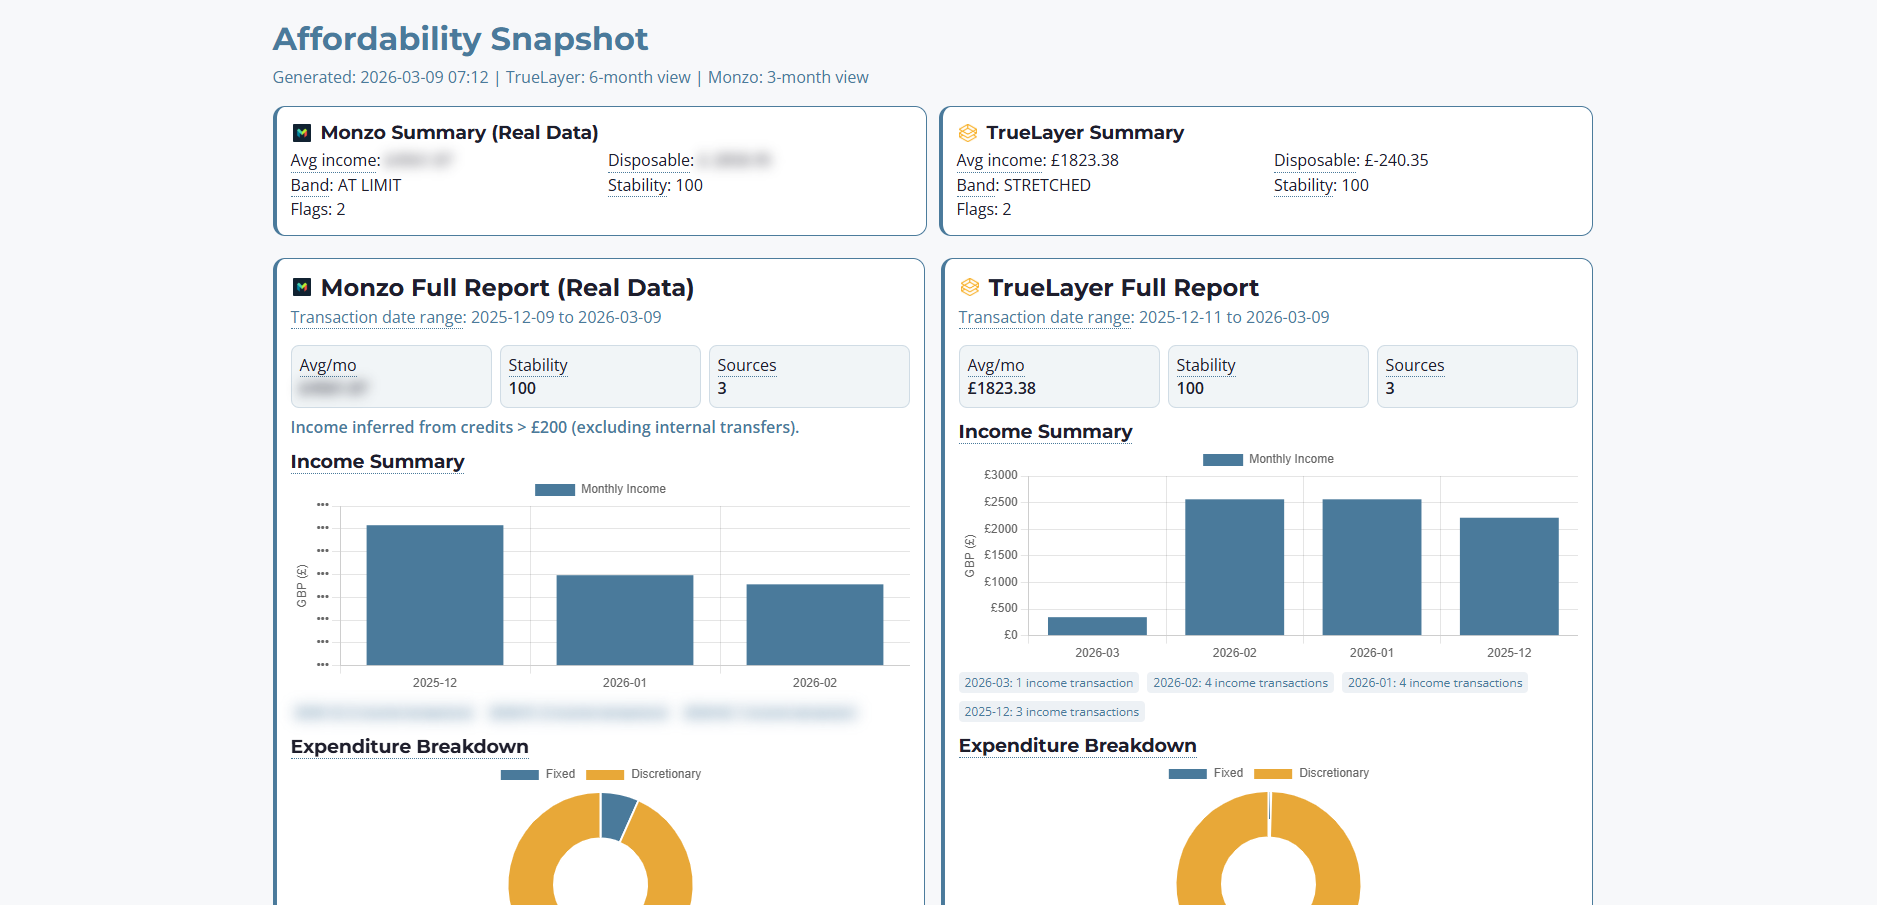
A Python tool that pulls transaction data from two Open Banking sources and runs an affordability analysis pipeline on both, and renders a single side-by-side HTML report. The report uses two data sources; TrueLayer (a free API for synthetic bank data) and also Monzo (for me to see my actual data).
On the generated report, the data source being investigated (the tool allows either one source or both to be run at once) is analysed to extract income and categorise expenditure, allowing the tool to categorise the consumer data into an affordability band. It creates an income stability score, looks as disposable income, calculates a debt-to-income ratio and flags negative behaviours such as gambling transactions, overdraft usage or payday lenders - before placing the user into an affordability category.
At the bottom of the report is an API explorer section, allowing the user to see the API endpoints and data structure returned.
Lessons Learned
The key lesson learned here was the approach to which affordability lenders review a customer's financial data in order to evaluate and categorise them into an affordability band.
Whilst my analysis pipeline isn't perfectly tuned or aligned with market lenders' processes, the fundamentals are the same, with key factors such as flagging certain transactions, considering income stability and looking at disposable income being heavily involved in decisions.
The MVP also gave me insight into the data structures retuned by open banking sources, showing transactions, account details and balances.
Finally, the project also introduced me to some new terms such as DTI (debt-to-income) ratio and concepts such as disposable buffer and income stability.
If I was to develop the MVP further, I'd further tune the analysis pipeline to better identify active payday lenders (as my report had false flags) and improve the disposable buffer calculation to do a better job at discounting irregular income values across the data.
Project Links: