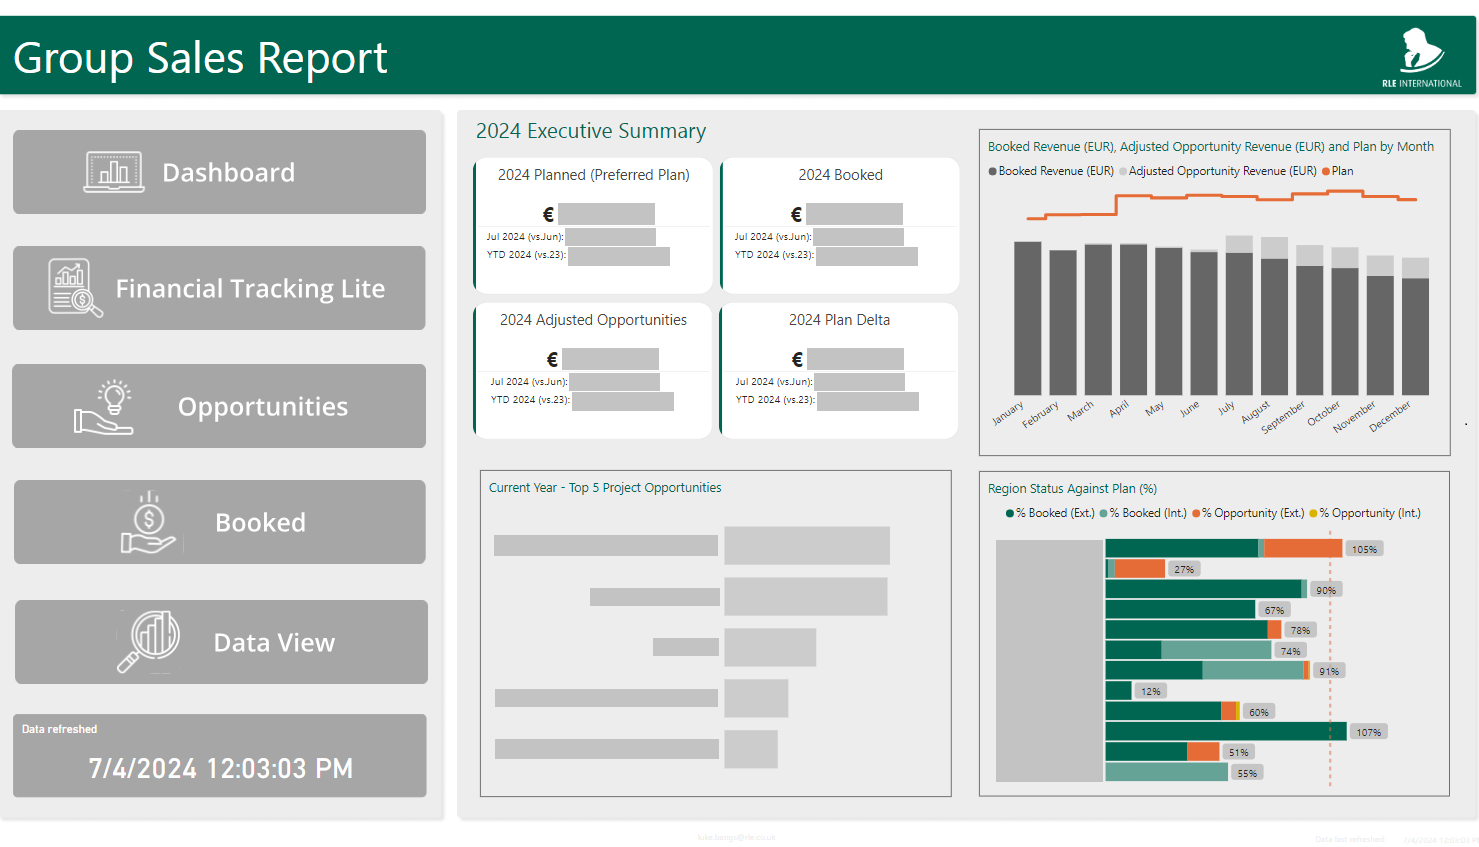
Group Sales Report
Jul 2023 - Jul 2024
Category: Work Project
Used in 5 projects
Used in 7 projects
Used in 9 projects
Used in 5 projects
Used in 10 projects
Description
The report section for the Financial Tracker showing global RLE International data. Financial data split out by region for all RLE International entities, showing booked and opportunities. This Power BI report was management level reporting, showing regions rolled together up to show the companies finances projections against target.
Lessons Learned
The key functionality for the graphics was developed by Alex Sheers on this report. My role was the navigation between pages and usability.
I learned how best to develop images for use as page and button backgrounds in Figma to get pixel perfect images and help separate the content of each page into distinguishable sections to aid readability.
I learned how best to develop images for use as page and button backgrounds in Figma to get pixel perfect images and help separate the content of each page into distinguishable sections to aid readability.
Developed For
RLE International
Project Links: